
NSHM23 Release & Inversion Paper published
A large group of scientists at the USGS and supporting institututions have collaborated to build the 2023 update to the National Seismic Hazard Model (NSHM23). NSHM23 was recently released, and this press release from the USGS highlights key findings.
This has been my primary project for the previous 3 years. Specifically, I worked on the fault-system earthquake rate model for the western U.S. As part of this process, I recently published a paper documenting the inversion methodology that we used in Bulletin of the Seismological Society of America. Give it read here, or see the abstract and selected figures below.
Kevin R. Milner, Edward H. Field; A Comprehensive Fault‐System Inversion Approach: Methods and Application to NSHM23. Bulletin of the Seismological Society of America 2023; doi: https://doi.org/10.1785/0120230122
Abstract
We present updated inversion‐based fault‐system solutions for the 2023 update to the National Seismic Hazard Model (NSHM23), standardizing earthquake rate model calculations on crustal faults across the western United States. We build upon the inversion methodology used in the Third Uniform California Earthquake Rupture Forecast (UCERF3) to solve for time‐independent rates of earthquakes in an interconnected fault system. The updated model explicitly maps out a wide range of fault recurrence and segmentation behavior (epistemic uncertainty), more completely exploring the solution space of viable models beyond those of UCERF3. We also improve the simulated annealing implementation, greatly increasing computational efficiency (and thus inversion convergence), and introduce an adaptive constraint weight calculation algorithm that helps to mediate between competing constraints. Hazard calculations show that ingredient changes (especially fault and deformation models) are the primary driver of hazard changes between NSHM23 and UCERF3. Updates to the inversion methodology are also consequential near faults in which the slip rate in UCERF3 was poorly fit or was satisfied primarily using large multifault ruptures that are now restricted by explicit b‐value and segmentation constraints.
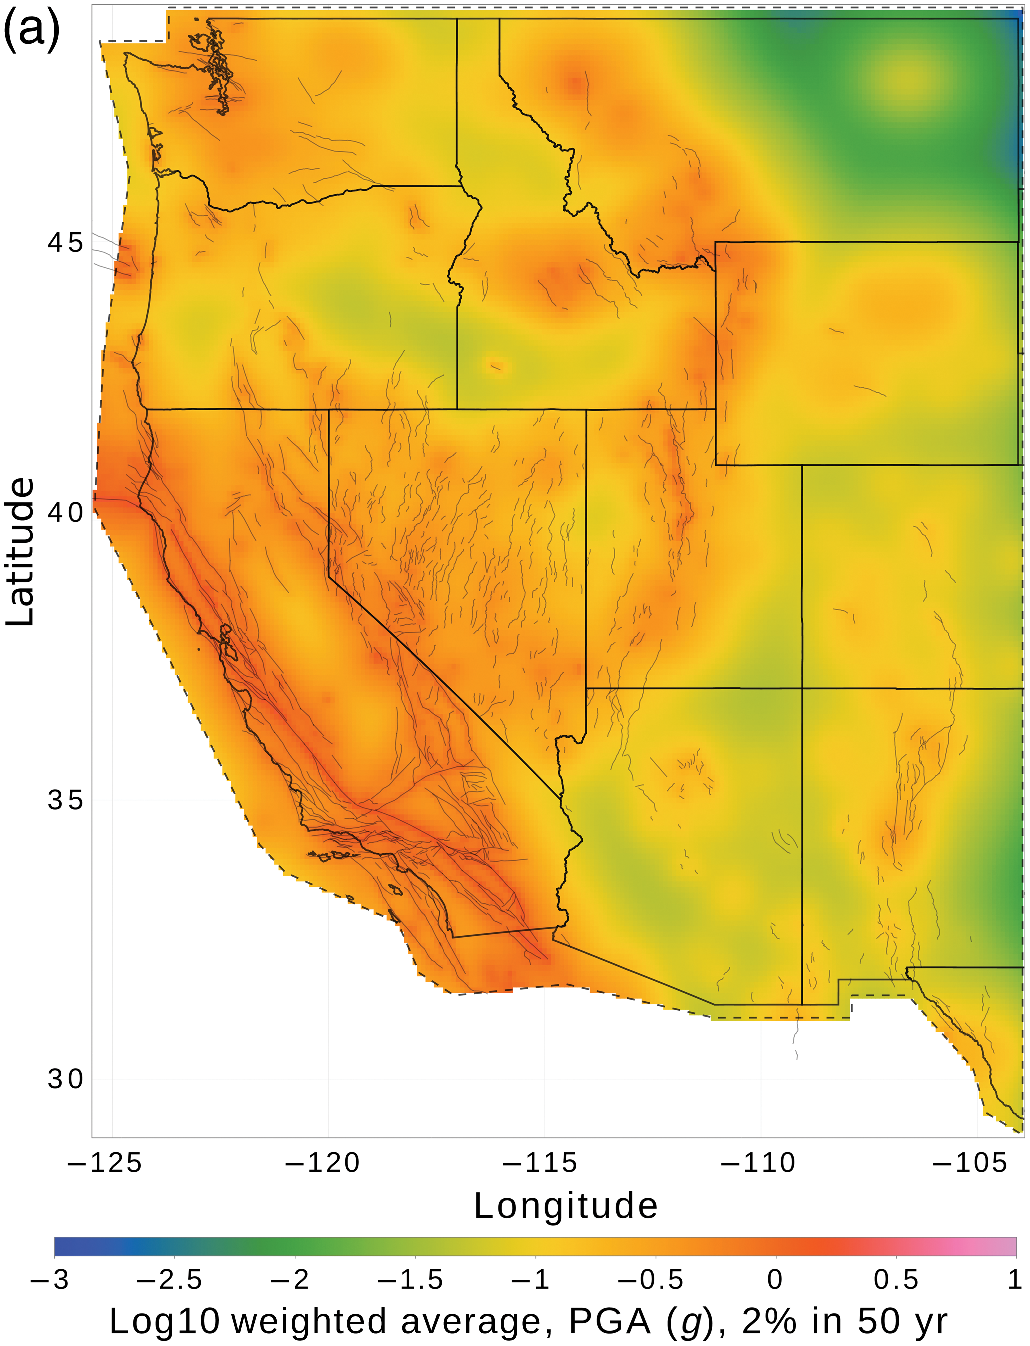
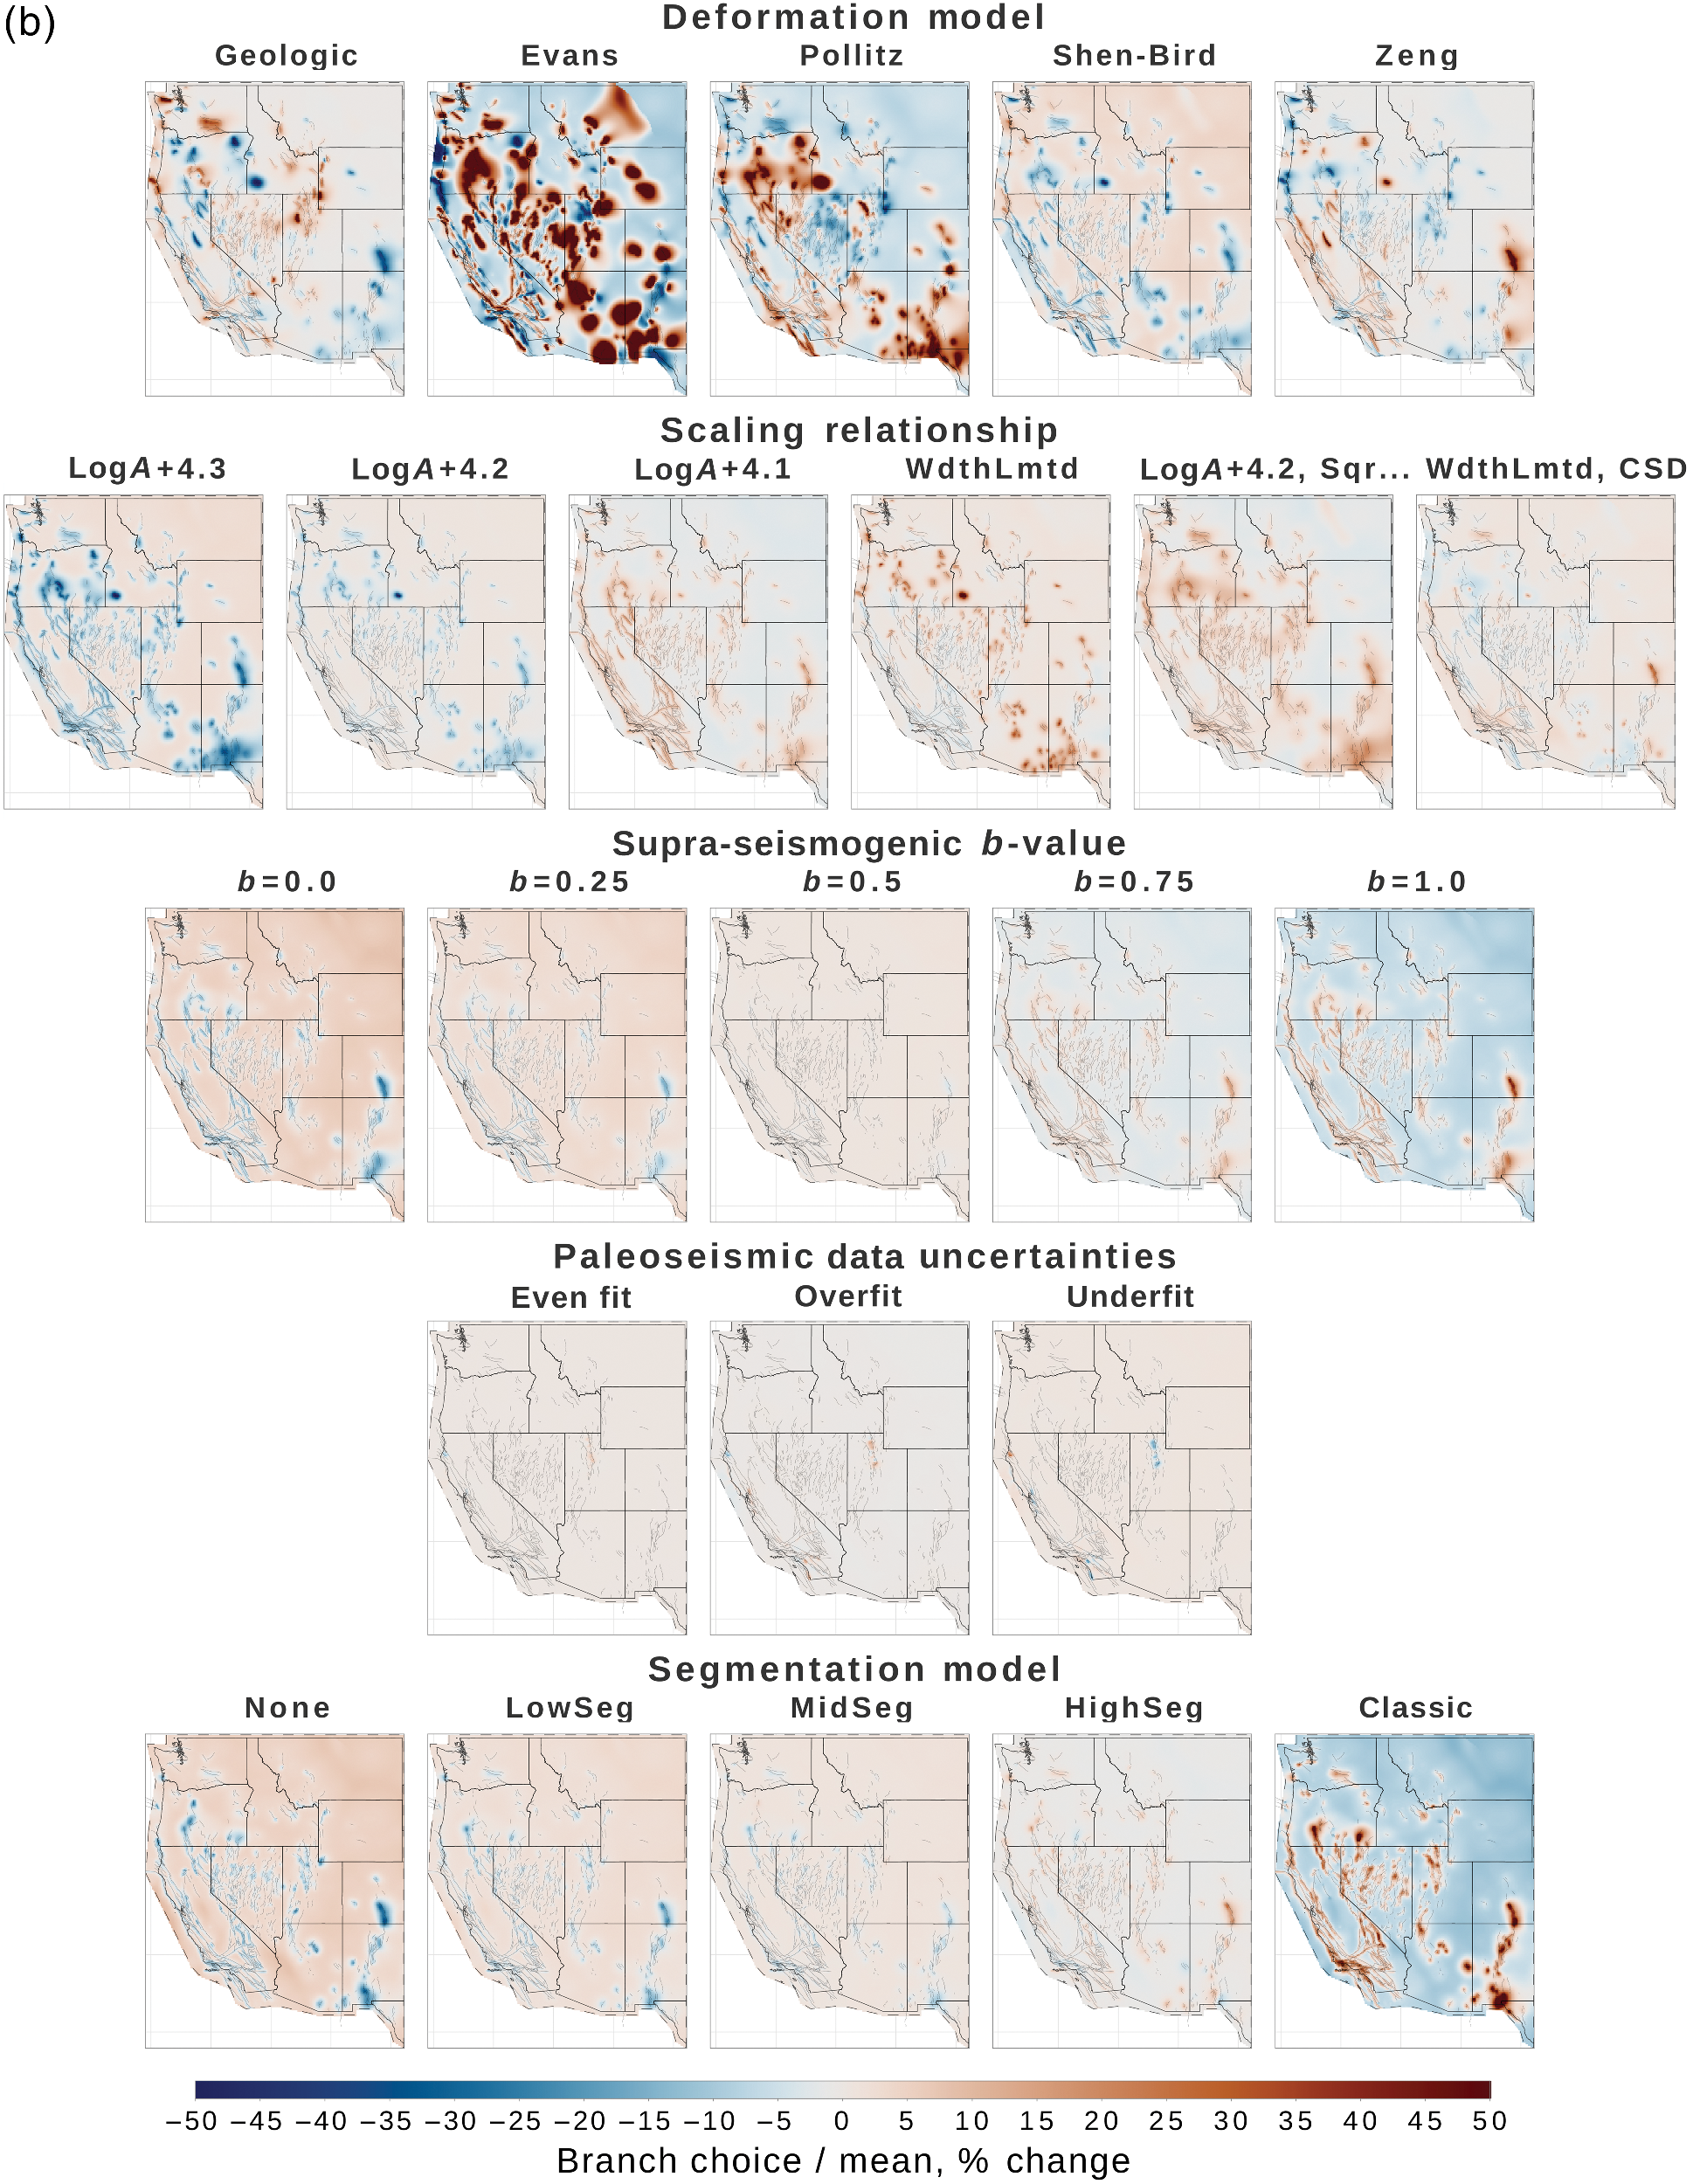
Figure 22 Western U.S. NSHM23 hazard maps of PGA 2% in 50 yr hazard. (a) The full mean hazard map. (b) The effect of individual fault‐based logic‐tree branches. Organized into rows for each branching level, each smaller map in panel (b) shows the ratio of hazard computed with each specific submodel (but averaged across all other branches) to the full mean hazard map. In other words, they show how the mean map would change if all other choices at that branching level were eliminated. In addition to the logic tree branches introduced in Figure 2, we include branches for deformation models (Pollitz et al., 2022) and scaling relationships (Shaw, 2023).