
Physics-Based PSHA paper published in Bulletin of the Seismological Society of America
Our paper entitled “Toward Physics‐Based Nonergodic PSHA: A Prototype Fully Deterministic Seismic Hazard Model for Southern California” was just published in Bulletin of the Seismological Society of America. Give it read here, or see the abstract and selected figures below.
Kevin R. Milner, Bruce E. Shaw, Christine A. Goulet, Keith B. Richards‐Dinger, Scott Callaghan, Thomas H. Jordan, James H. Dieterich, Edward H. Field; Toward Physics‐Based Nonergodic PSHA: A Prototype Fully Deterministic Seismic Hazard Model for Southern California. Bulletin of the Seismological Society of America doi: https://doi.org/10.1785/0120200216
Abstract
We present a nonergodic framework for probabilistic seismic‐hazard analysis (PSHA) that is constructed entirely of deterministic, physical models. The use of deterministic ground‐motion simulations in PSHA calculations is not new (e.g., CyberShake), but prior studies relied on kinematic rupture generators to extend empirical earthquake rupture forecasts. Fully dynamic models, which simulate rupture nucleation and propagation of static and dynamic stresses, are still computationally intractable for the large simulation domains and many seismic cycles required to perform PSHA. Instead, we employ the Rate‐State earthquake simulator (RSQSim) to efficiently simulate hundreds of thousands of years of M≥6.5 earthquake sequences on the California fault system. RSQSim produces full slip‐time histories for each rupture, which, unlike kinematic models, emerge from frictional properties, fault geometry, and stress transfer; all intrinsic variability is deterministic. We use these slip‐time histories directly as input to a 3D wave‐propagation code within the CyberShake platform to obtain simulated Fmax=0.5 Hz ground motions. The resulting 3 s spectral acceleration ground motions closely match empirical ground‐motion model (GMM) estimates of median and variability of shaking. When computed over a range of sources and sites, the variability is similar to that of ergodic GMMs. Variability is reduced for individual pairs of sources and sites that repeatedly sample a single path, which is expected for a nonergodic model. This results in increased exceedance probabilities for certain characteristic ground motions for a source–site pair, while decreasing probabilities at the extreme tails of the ergodic GMM predictions. We present these comparisons and preliminary fully deterministic physics‐based RSQSim–CyberShake hazard curves, as well as a new technique for estimating within‐ and between‐event variability through simulation.
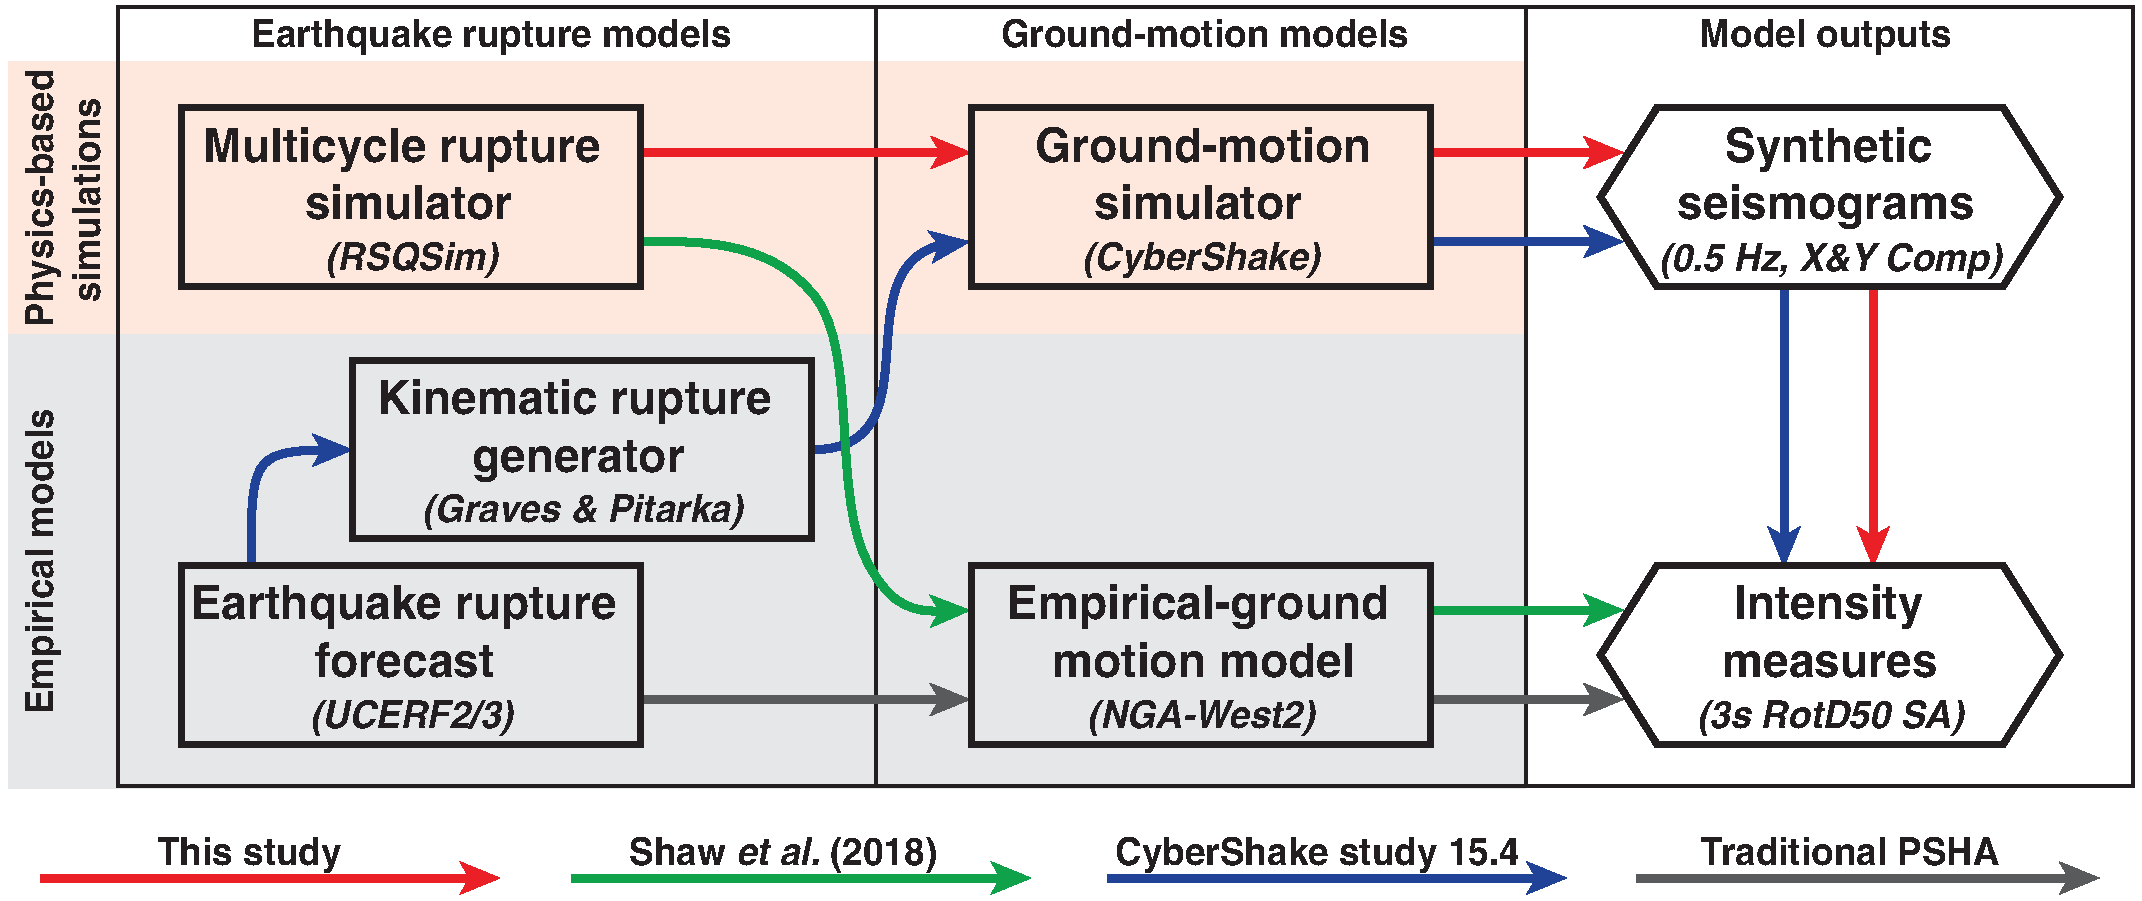
Figure 1 Probabilistic seismic‐hazard analysis (PSHA) pathways. This study presents a new pathway, shown with red arrows, which combines a multicycle earthquake rupture simulator directly with a ground‐motion simulator to compute synthetic seismograms. Shaw et al. (2018), shown with green arrows, combined a multicycle earthquake rupture simulator with an empirical ground‐motion model (GMM). Prior CyberShake studies, shown with blue arrows, used a kinematic rupture generator to extend an empirical earthquake rupture forecast (ERF) for ground‐motion simulation. Traditional PSHA studies, shown with gray arrows, combine an empirical ERF with empirical GMMs.
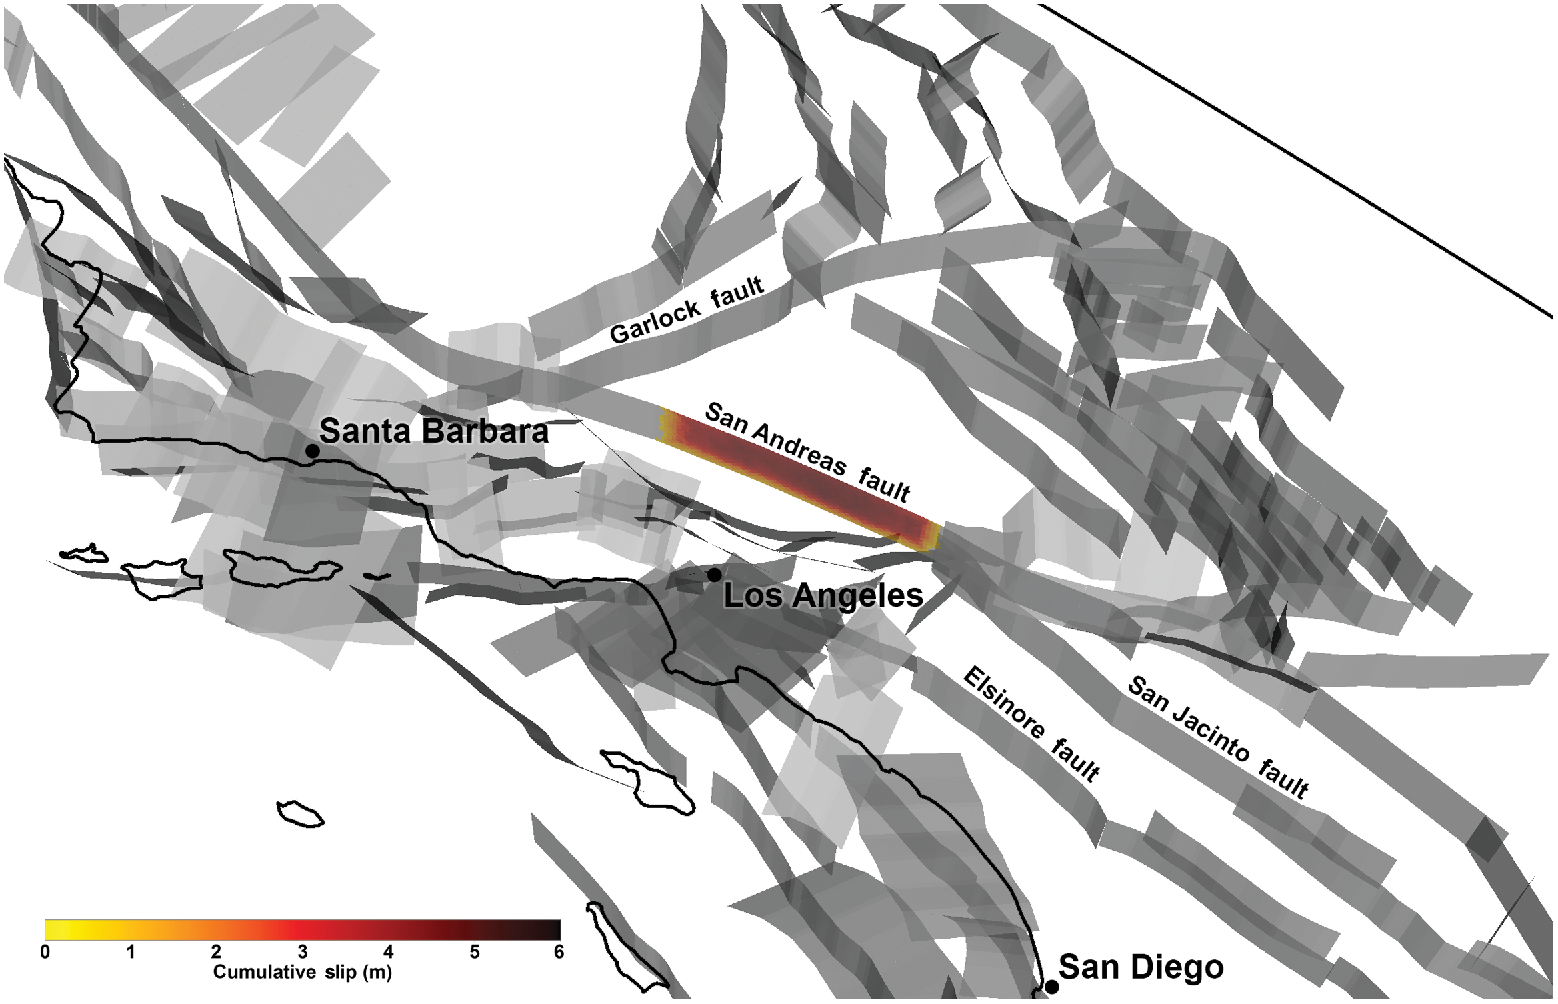
Figure 3 3D perspective view looking north of faults considered in southern California, highlighting an M 7.5 simulated Rate‐State earthquake simulator (RSQSim) rupture on the Mojave section of the San Andreas fault. Darker colors represent higher patches of total cumulative slip, and major faults and cities are annotated. All other fault patches that did not participate in the rupture are shown in gray.
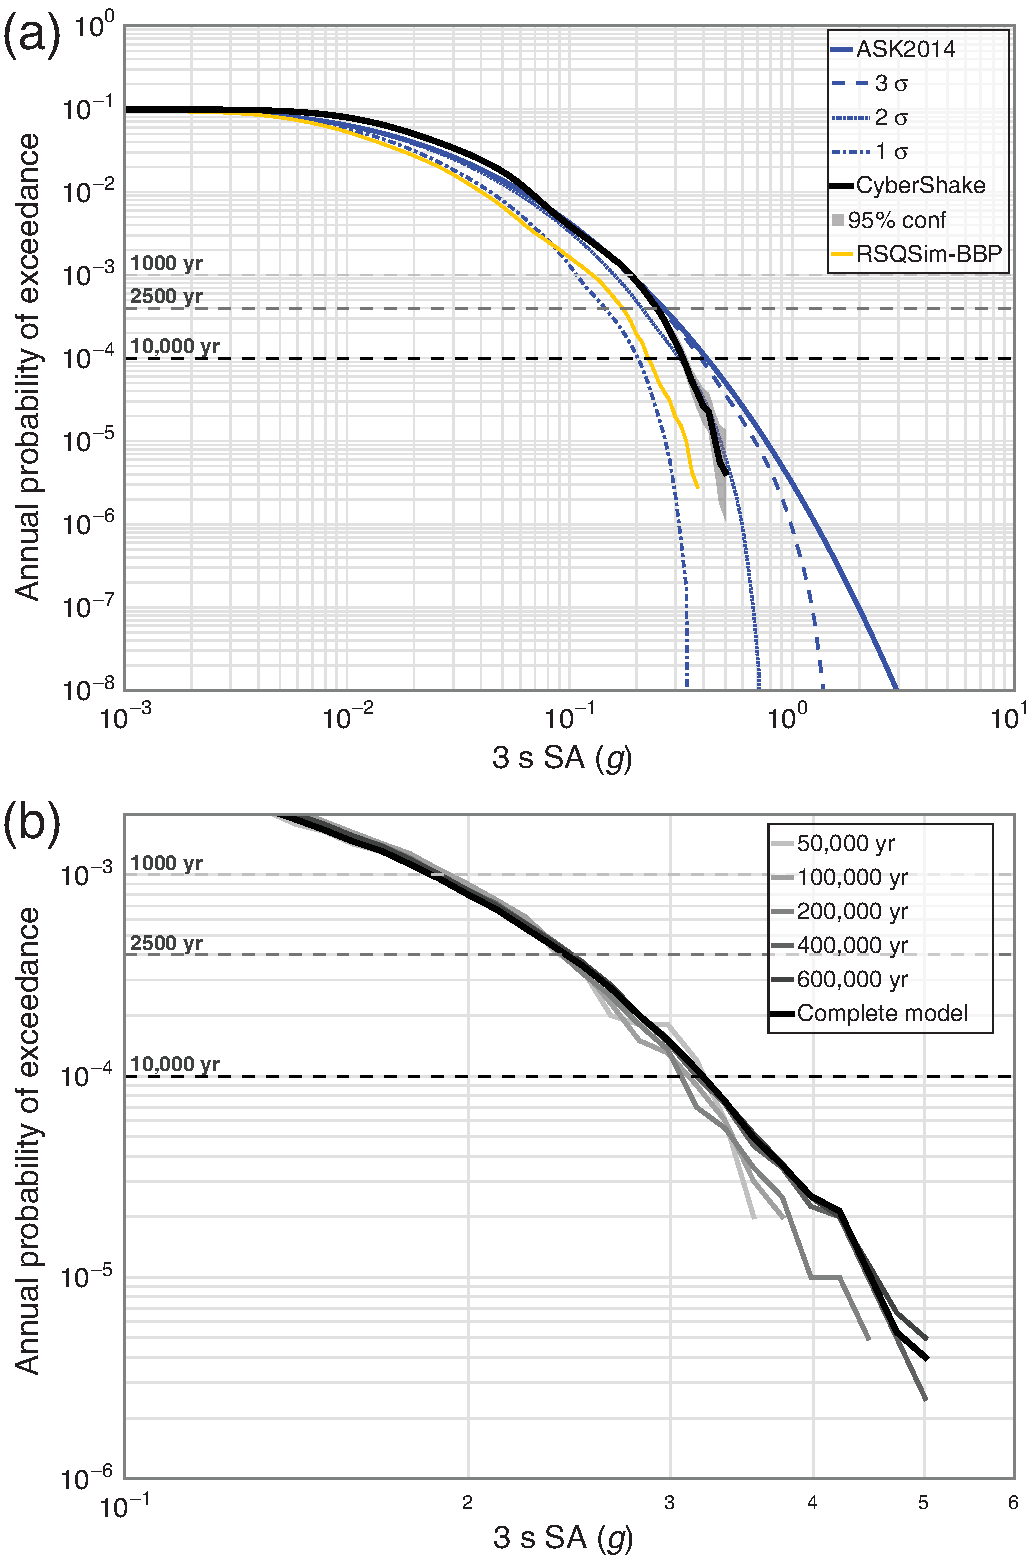
Figure 15 RSQSim simulation hazard curves at USC. CyberShake (3D) is plotted with thick, black lines. (a) ASK2014 GMM comparisons curves in blue, with the complete hazard curve plotted as a thick solid line. GMM curves computed from truncated lognormal distributions at 3‐, 2‐, and 1‐σ are plotted with dashed, dotted, and dotted and dashed lines, respectively. The 1D BBP hazard curve is included in yellow, and 95% confidence bounds assuming a binomial distribution (representing sampling uncertainty from a finite catalog duration) on the 3D simulated curve are depicted as a gray shaded region. (b) An enlarged view of CyberShake hazard curves, including curves computed with different RSQSim catalog lengths. The complete catalog is shown (after discarding spin‐up time) with a thick black line, and subsets of the catalog, starting with the first 50,000 simulated yr in light gray, are shown in thin and increasingly dark lines with increasing duration.